Statistics at grassroots level you've never had before
The same frameworks AFL clubs use to win games — built for grassroots coaches, on any device, with one person and two minutes of training.
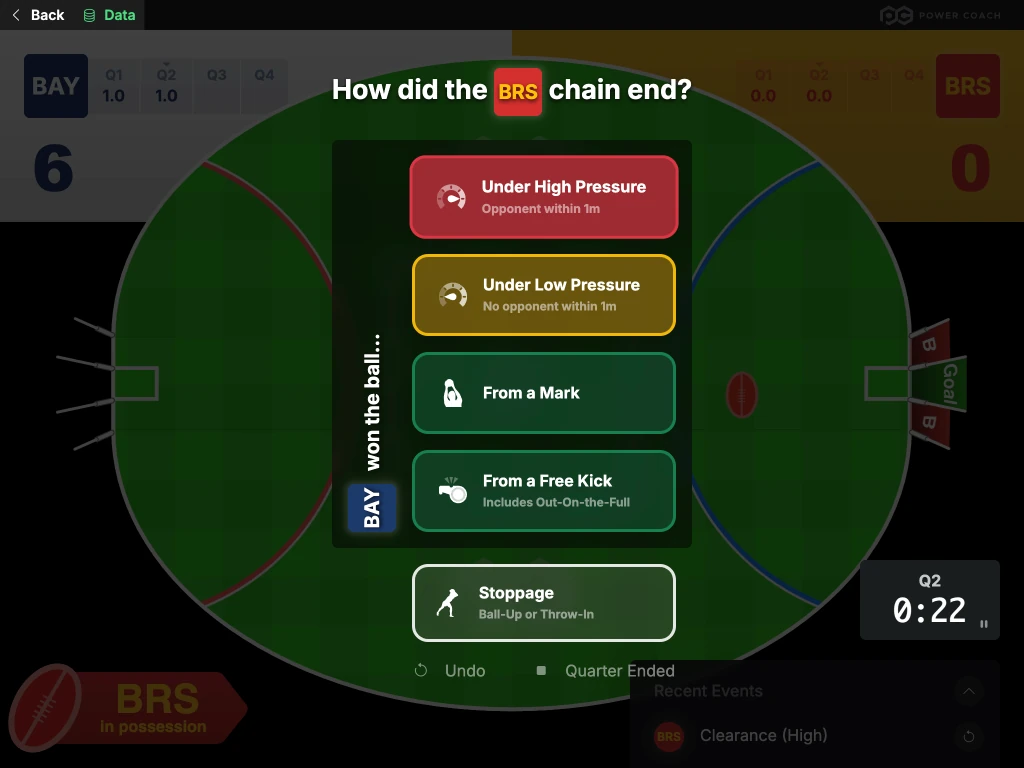
Super simple stat capture
Other tools make you log every kick, mark, and handball — over 1,200 events per game. Powercoach captures ∼250 chains of possession per game and delivers richer insights from far less effort.
-
One person, one device. A volunteer — no stats background needed.
-
Two minutes to learn. Tap where a chain starts. Tap where it ends. That's it.
-
Any device. iPad, tablet, or phone. Browser-based — nothing to install.
-
Chains, not clicks. Each chain captures zone, outcome, and context automatically.
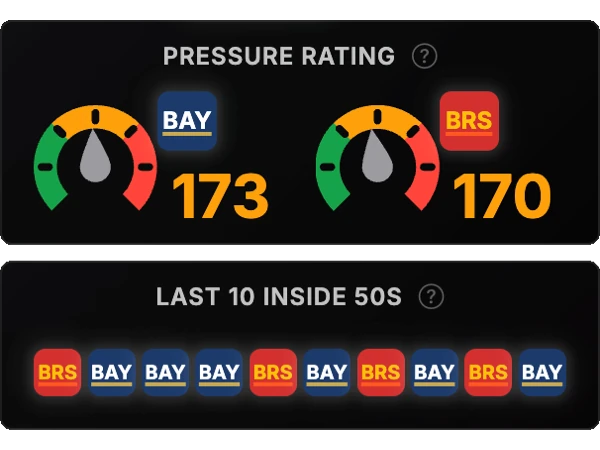
Territory, pressure & chain quality
The stats that professional AFL clubs actually use to make decisions — now live, during your game. Not after watching the replay.
-
Territory control by zone — see exactly where you're winning and losing the field.
-
Pressure ratings — is your pressure actually converting to outcomes?
-
Chain quality — track how effective your chains of possession are, end to end.
-
Inside 50s, clearances, contested possessions — all live, all in context.
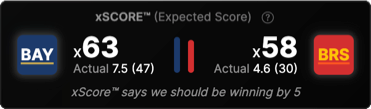
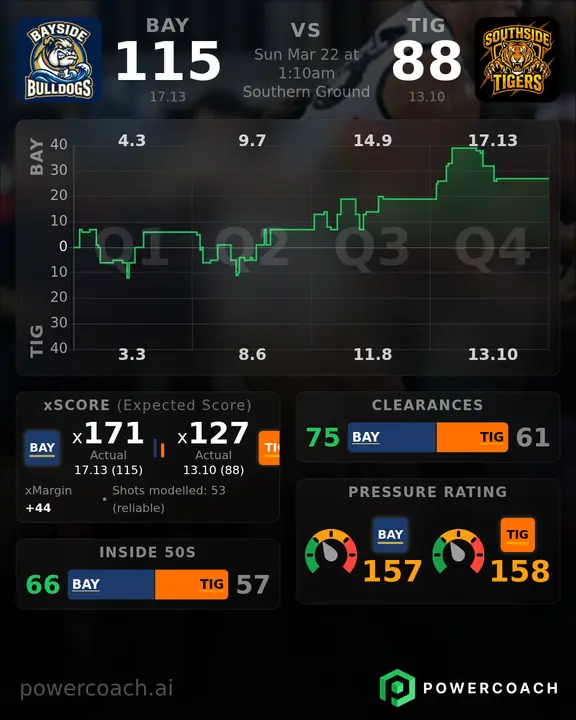
Expected score (xScore™)
The scoreboard sometimes lies. xScore™ shows you what the score should be based on shot quality and historical conversion rates — so you don't panic and change a winning strategy.
- Shot quality scored by zone and distance
- Quarter-by-quarter breakdown
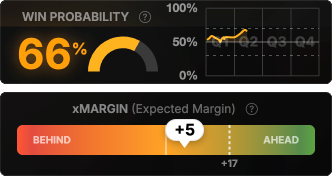
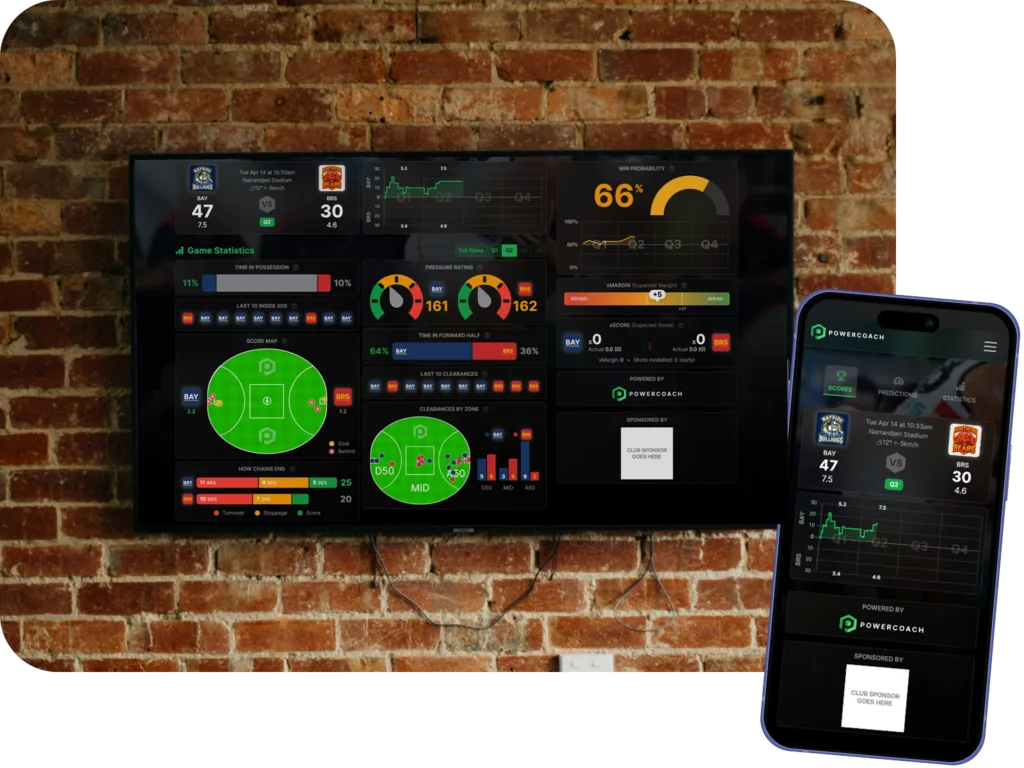
Win probability & expected margin
How likely are you to win right now — and by how much? Powercoach turns your live data into a single, at-a-glance read on where the game is really heading, so you know whether to chase it or hold your nerve.
-
Live win probability — updated after every chain, not just at quarter time.
-
Expected margin — the scoreline the game should be at, based on shot quality and chain momentum.
-
Ahead or behind pace? See at a glance whether you're over-performing, under-performing, or on track.
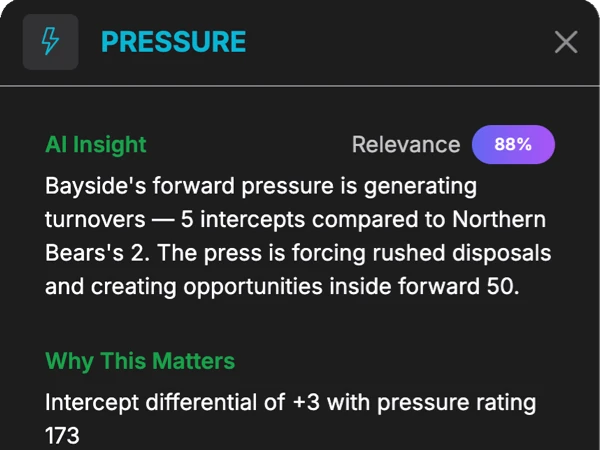
AI coaching insights
At quarter time, Powercoach generates a tactical summary of what's happened — patterns, trends, and recommendations — trained on 15 years of AFL analyst insight from Robbie Chancellor, assistant coach at GWS Giants.
-
Not generic AI. Trained on the frameworks Robbie used at Melbourne, St Kilda, and GWS Giants.
-
Patterns humans miss. The AI tracks trends across hundreds of chains simultaneously.
-
Actionable, not abstract. Recommendations you can act on during a break.
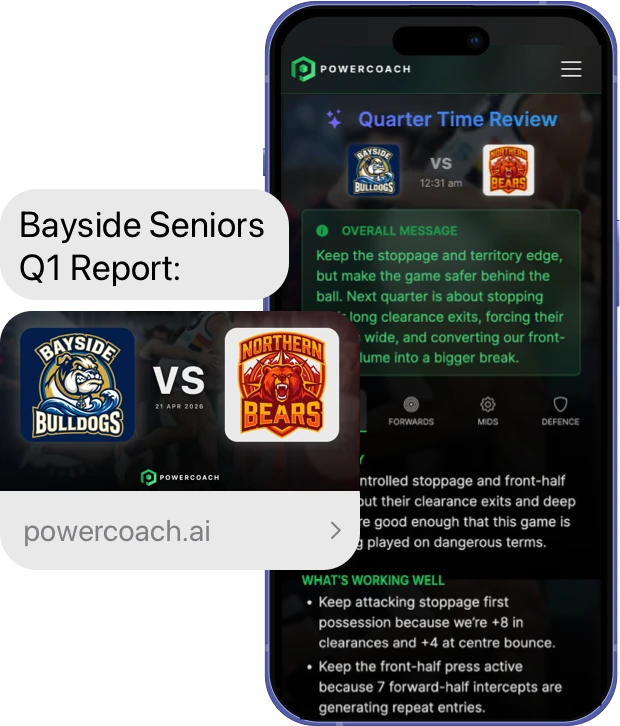
Every coach. Every break. On their phone.
Most clubs share one iPad on game day — the head coach drives it, and the assistants are left out of the AI break-time analysis. Powercoach fixes that. The moment a quarter ends, every coach gets a text message with a link to the report — tailored to their group.
-
Texted automatically at every break — Q1, half time, Q3, and post-game.
-
Role-specific tabs for forwards, mids, and defence — each assistant lands on their own briefing.
-
One tap, no login. Links stay live for 20 minutes — long enough to read, lead the huddle, and get back on the field.
-
Post-game, every coach gets the full review — readable on the drive home, no iPad needed.
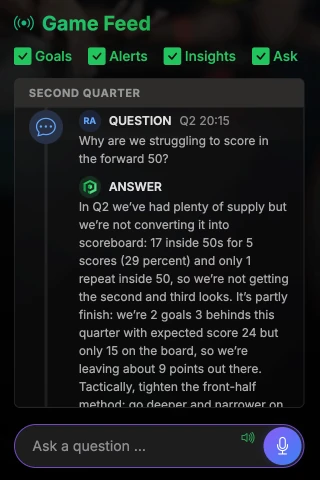
Ask the AI Brain™. Mid-game.
The Powercoach AI Brain™ changes everything. Ask any question about your game and get an instant answer grounded in your live data — not generic advice.
- Grounded in your actual live data, not generalities
- Ask the AI Brain™ anything, any time during the game
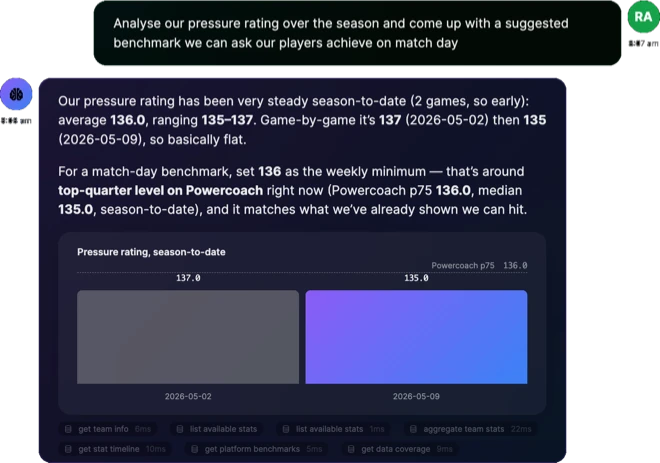
AI Brain Chat™ — your season analyst
A coaching analyst that knows your team inside out. Break down a single game, surface season trends, prep for an opponent, or stress-test a tactical idea — just ask. Every answer is grounded in your captured games, weighed against platform-wide benchmarks.
-
Grounded in your data. No generic advice — answers cite your actual games, opponents, and trends.
-
Benchmarked across the platform. See where you sit against other teams — medians, percentiles, what "good" looks like.
-
Set match-day KPIs. Pinpoint what separates your wins from losses and turn it into a target your players can hit.
-
Private to you. Other coaches on your team can’t see your chats — ask the questions you’d rather think through on your own.
Game summaries your organization will share
One tap generates a professional game summary image — score, key stats, your team branding. Ready to post on Instagram, Facebook, or your organization website the moment the game ends.
-
Branded automatically with your team colors and logo.
-
Public share links anyone can view without logging in.
-
Included in every plan — even Foundation.
Supporter Dashboard
Keep your club community connected to every game. The Supporter Dashboard gives fans, families, and sponsors a live, read-only view of your stats.
-
You choose what they see. Pick exactly which stats appear — supporters get your curated view, nothing more.
-
Complete access control. Invite individuals, open it to anyone who signs up, or share a single public link.
-
Built-in sponsor placement. Display your club sponsor’s logo on every supporter’s screen for every minute of the game.
Book a free setup call
15 minutes. We'll help you get set up for your first game and answer any questions.
Ready to jump straight in?
Set up your free first gameHow Powercoach compares
Real features, not promises
| Capability | Manual / Spreadsheet | Other Stats Apps | Powercoach |
|---|---|---|---|
| Territory tracking | ✕ | Rarely | ✓ Live |
| Expected Score (xScore™) | ✕ | ✕ | ✓ Real-time |
| AI tactical recommendations | ✕ | ✕ | ✓ Included |
| Conversational AI (Ask) | ✕ | ✕ | ✓ From $50/game |
| Training required | Hours | Days | ✓ 2 minutes |
| Data entry per game | 1,200+ events | 500–1,000 | ✓ ~250 chains |
| Insights available | Next day | After game | ✓ Live |
Ready to see which plan suits your organization? See pricing
Sooner you start, sooner you build an edge
Every game you capture builds your team's intelligence — until you have a personalised winning formula.
First games · Correlations start to appear
From day one, you can see which stats matter most at grassroots level. Every game you capture adds to the picture for your team.
Mid-season · Patterns get clearer
Your own data starts to tell a story. Which stats trend higher in your wins? Where do your losses fall short?
Finals · A data-backed edge when it matters
You go into finals with a full season of insights. An advantage late starters don't get.
Future seasons · Your advantage compounds
Each season refines your winning formula. The gap between you and late starters only grows.
The earlier you start, the quicker you unlock insights your opponents don't have.
Set up your free first gameOr book a free setup call first